Automatically generates correlation plots of continuous variables from a database and a reference variable. The names of the variables are set to the names defined in the database. As a result, graphs generated with the default theme "theme_serene" will be obtained. In this function, the user must define each variable label with "label" function from "table1" package
Arguments
- data
Dataframe from which variables will be extracted
- referencevar
Reference variable. Must be continuous variable as string (quoted)
- point_args
List containing extra arguments to be passed to geom_point function. If no specified, only "stat="identity"" will be passed
- smooth_args
List containing extra arguments to be passed to geom_smooth function. If no specified, only "method="lm"" will be passed
- theme_func
Theme to display plots. Default is "theme_serene"
- lang_labs
Language to display title lab. Default is Spanish.
Value
Returns a list containing barplots as ggplot2 objects. Objects can be accessed via $ operator.
Examples
data <- data.frame(group = rep(letters[1:2], 30),
var1 = rnorm(30, mean = 15, sd = 5),
var2 = rnorm(30, mean = 20, sd = 2),
var3 = rnorm(30, mean = 10, sd = 1),
var4 = rnorm(30, mean = 5, sd =2))
cont_corrplot <- auto_corr_cont(data = data, referencevar = "var1", lang_labs = "EN")
# Call to show all storaged plots
cont_corrplot
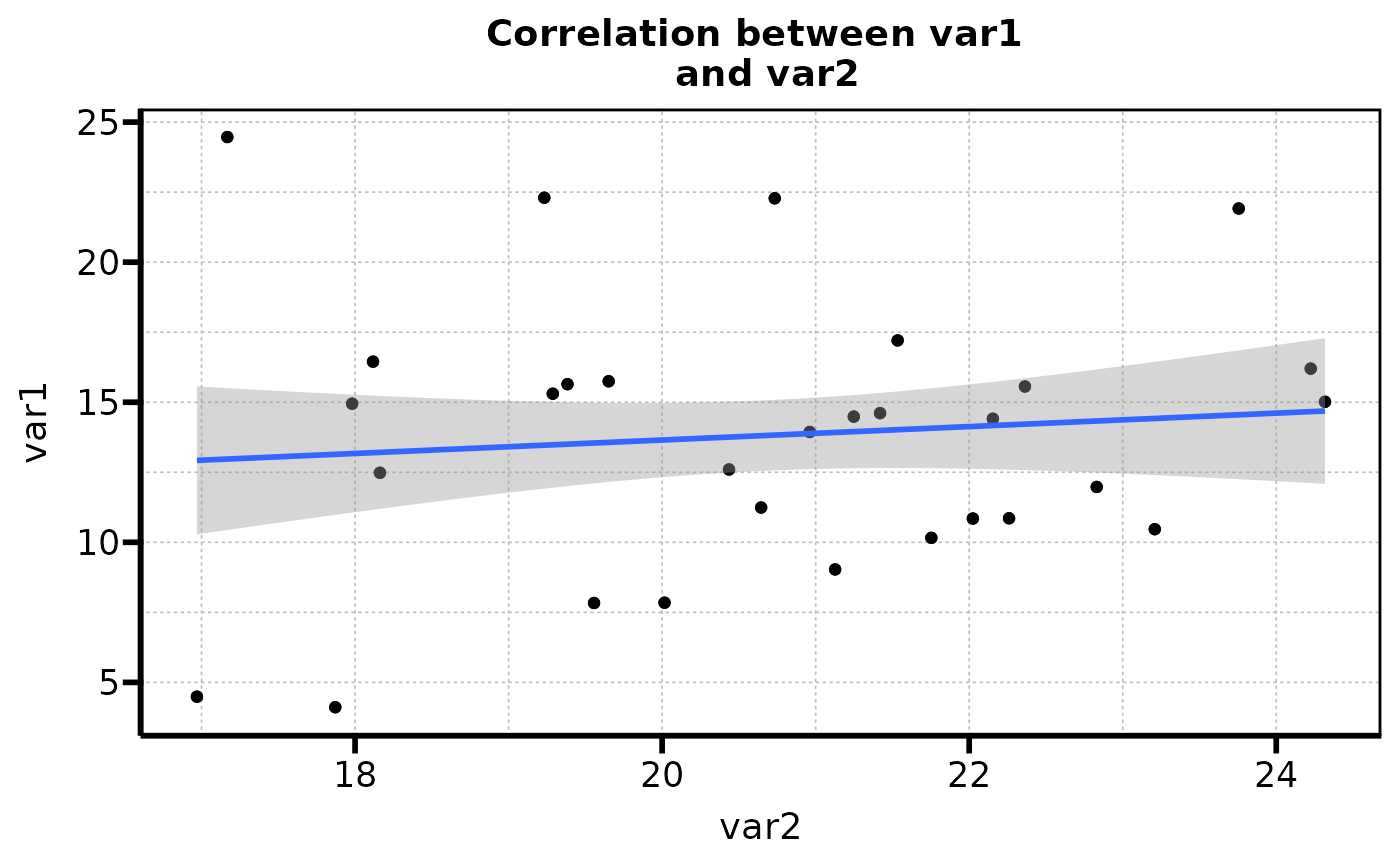
#> $var2
#> `geom_smooth()` using formula = 'y ~ x'
 #>
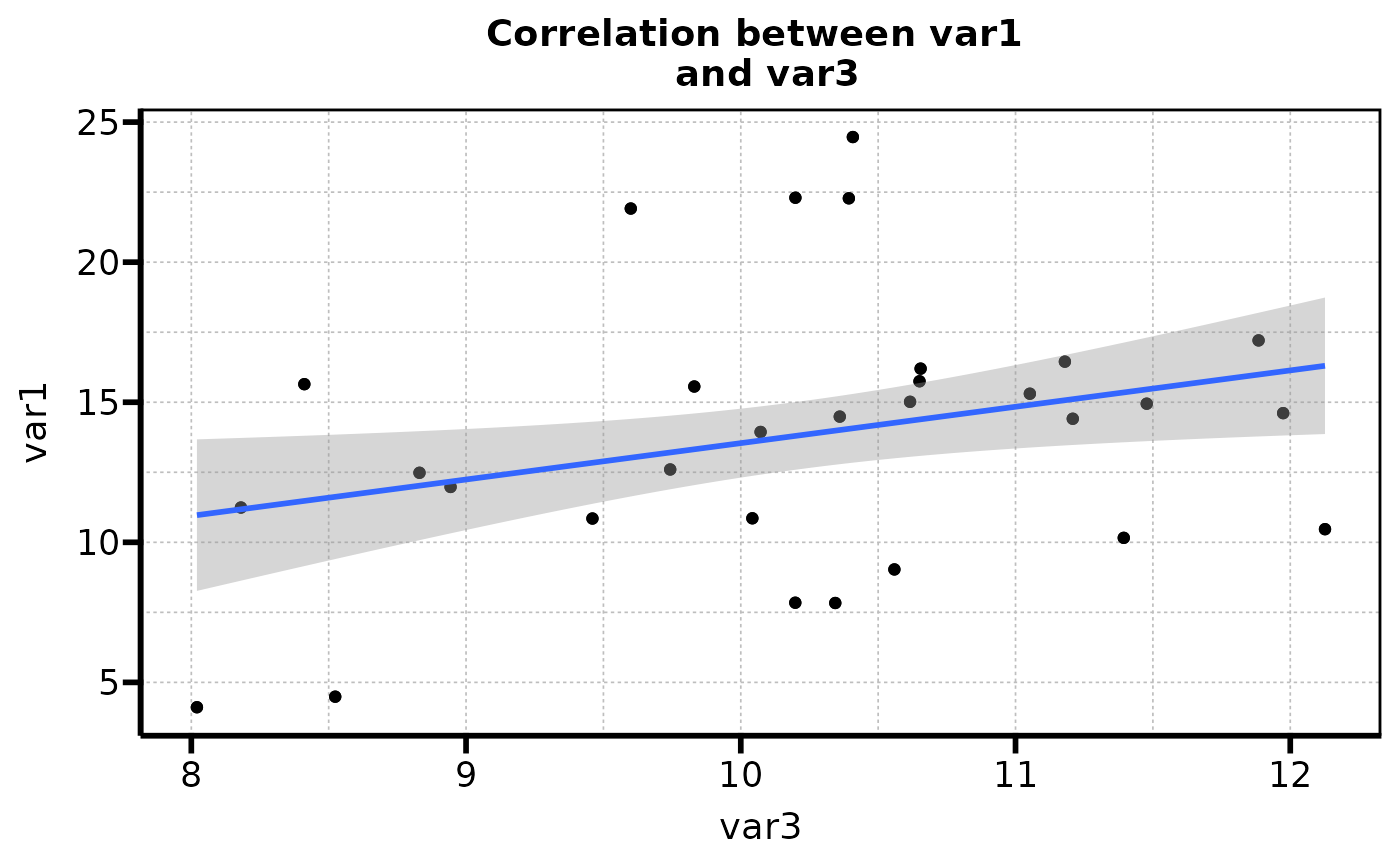
#> $var3
#> `geom_smooth()` using formula = 'y ~ x'
#>
#> $var3
#> `geom_smooth()` using formula = 'y ~ x'
 #>
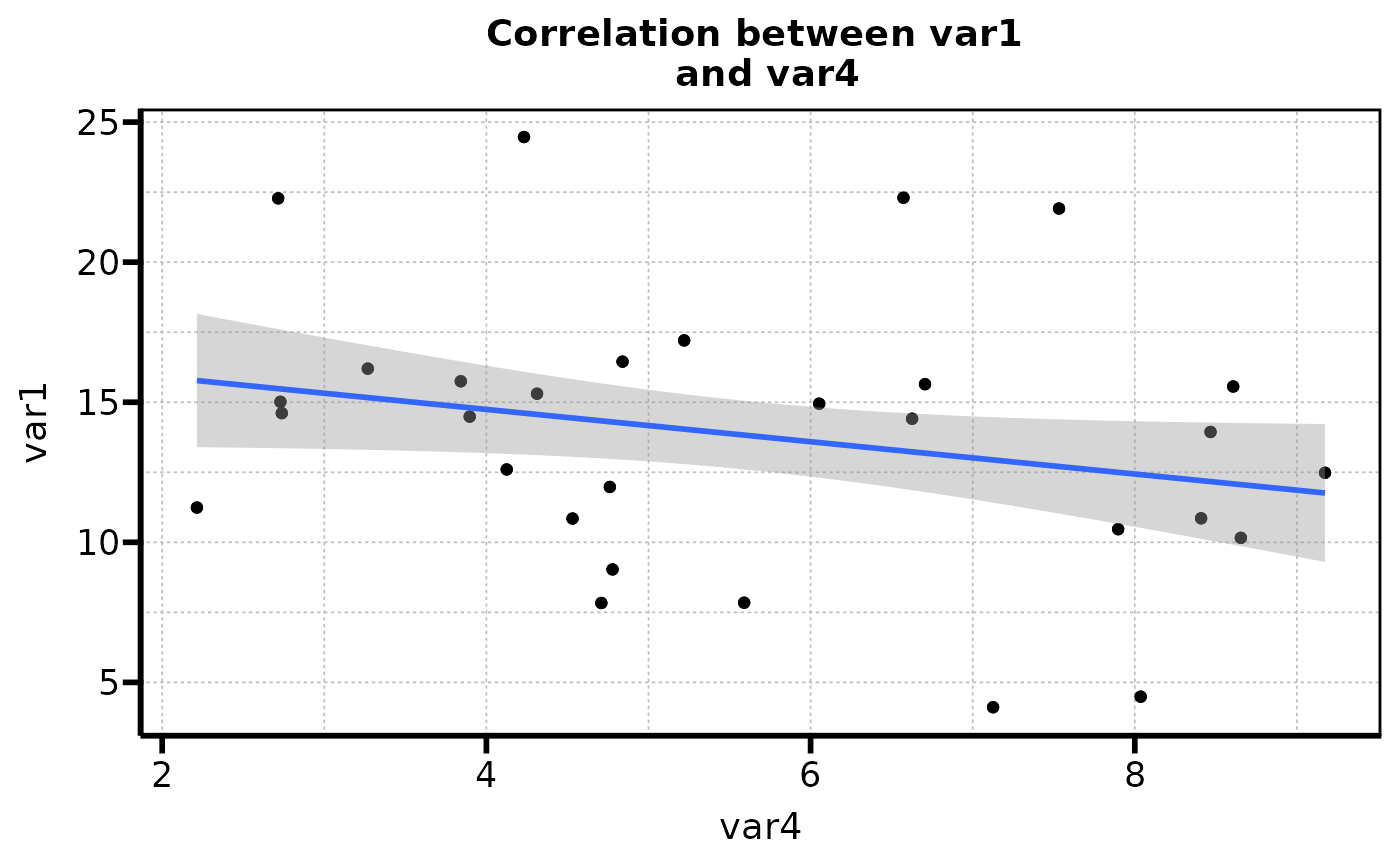
#> $var4
#> `geom_smooth()` using formula = 'y ~ x'
#>
#> $var4
#> `geom_smooth()` using formula = 'y ~ x'
 #>
# Call to show one individual plot
cont_corrplot$var2
#> `geom_smooth()` using formula = 'y ~ x'
#>
# Call to show one individual plot
cont_corrplot$var2
#> `geom_smooth()` using formula = 'y ~ x'