Generates bar plots of contiuous variables based on numerical variables from a data frame. Internally, the function creates a tibble to summarize the data from each variable.
Arguments
- data
Name of the dataframe
- groupvar
Grouping variable
- err_bar_show
Logical indicator. Default TRUE show error bars in columns. Default is TRUE
- err_bar
Statistic to be shown as error bar. Can be "sd" for standard deviation or "se" for standard error. Defauult is "se".
- col_args
Arguments to be passed to
geom_colinside the function. Default arguments are:fill="grey"
color = "black"
alpha = 0.8
- lang_labs
Language of the resulting plots. Can be "EN" for english or "SPA" for spanish. Default is "SPA"
- theme_func
Theme of the generated plots. Must be the name of the function without parenthesis. Use for example:
theme_minimalinstead oftheme_minimal()
Value
Returns a list containing barplots as ggplot2 objects. Objects can be accessed via $ operator.
Examples
data <- data.frame(group = rep(letters[1:2], 30),
var1 = rnorm(30, mean = 15, sd = 5),
var2 = rnorm(30, mean = 20, sd = 2),
var3 = rnorm(30, mean = 10, sd = 1),
var4 = rnorm(30, mean = 5, sd =2))
data$group<-as.factor(data$group)
# Create a list containing all the plots
barcontplots<-auto_bar_cont(data = data, groupvar = 'group', err_bar = "se", lang_labs = 'EN')
# call to show all storaged plots
barcontplots
#> $var1
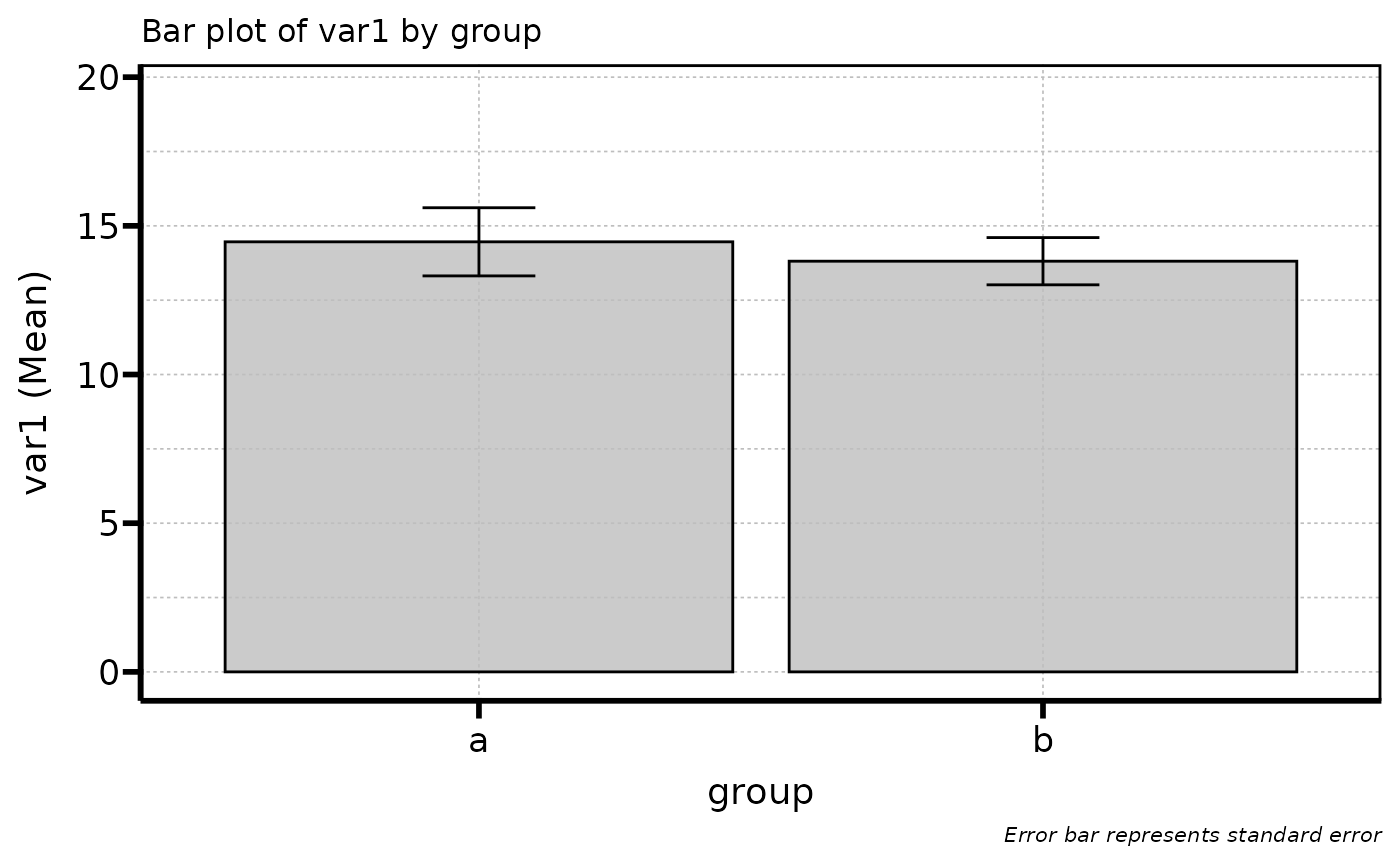 #>
#> $var2
#>
#> $var2
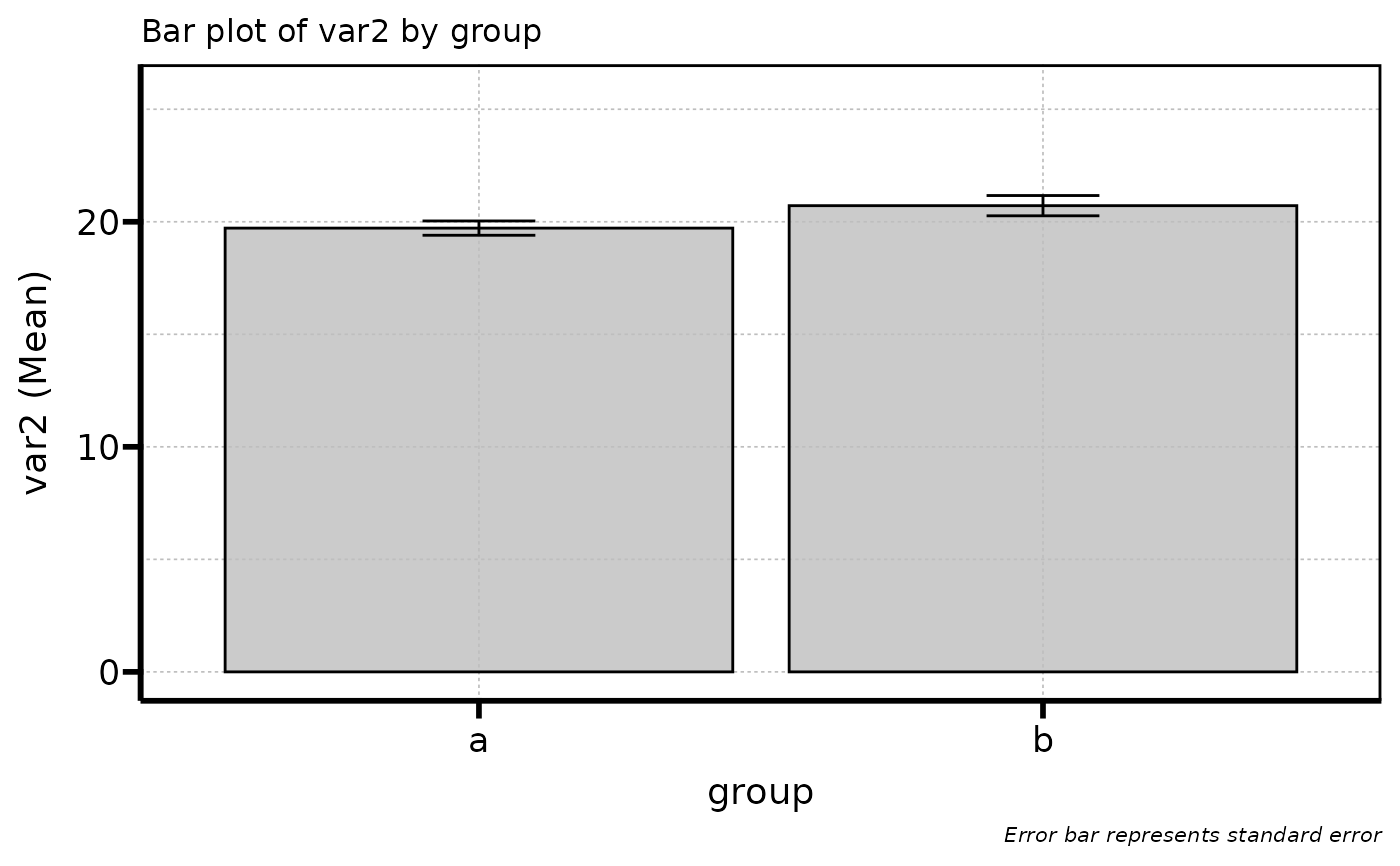 #>
#> $var3
#>
#> $var3
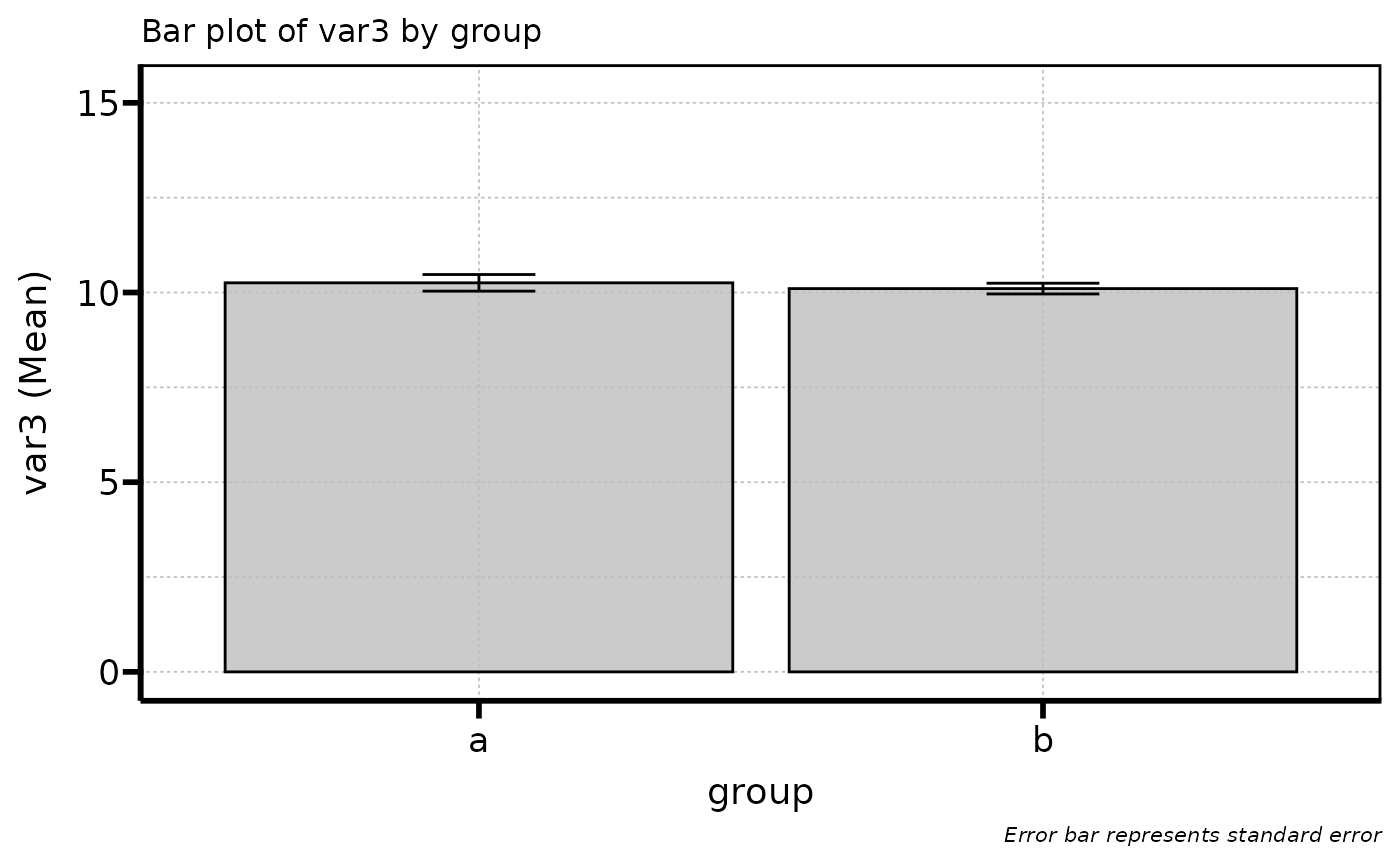 #>
#> $var4
#>
#> $var4
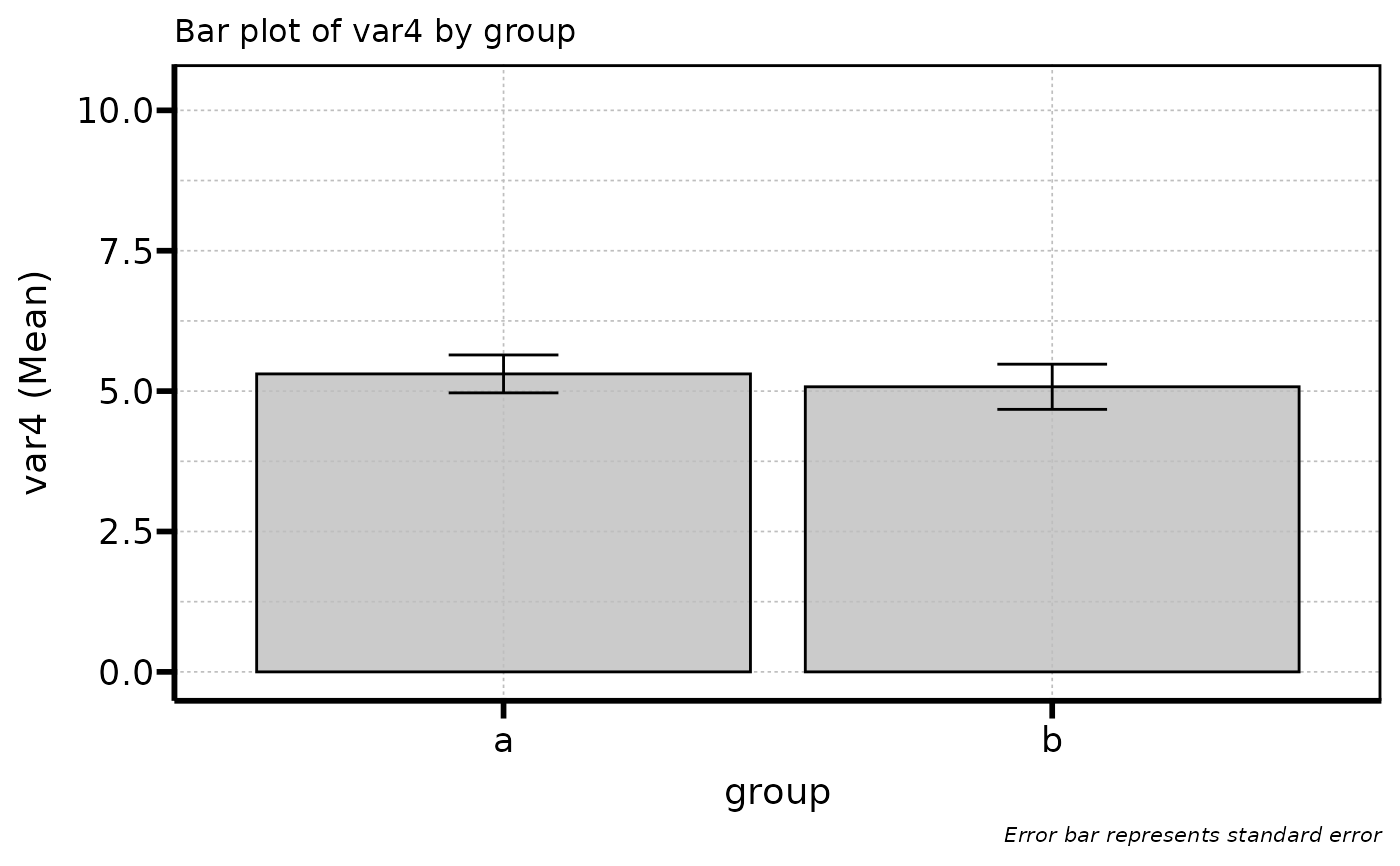 #>
# call to show one individual plots
barcontplots$var1
#>
# call to show one individual plots
barcontplots$var1
