Automatically generates barplot stratified by group variables with or without percentages.
Usage
auto_bar_categ(
  data,
  groupvar = NULL,
  bar_args = NULL,
  theme_func = theme_serene,
  lang_labs = NULL,
  showpercent = TRUE,
  drop_na = TRUE
)
Arguments
- data
Name of the dataframe
- groupvar
Name of the grouping variable. Grouping variable will be used in "fill" for aesthetics argument in the creation of each ggplot object. If not provided, the function take each variable as grouping and does not display the "fill" legend.
- bar_args
List of arguments to be passed to "geom_bar". If
NULL, the function uses default arguments such as:position = "dodge"
colour = "black"
linewidth = 0.9
alpha = 0.5
- theme_func
Theme of the generated plots. Must be the name of the function without parenthesis. Use for example:
theme_minimalinstead oftheme_minimal()- lang_labs
Language of displayed labels. If null, default is spanish.
- showpercent
Logical atribute to indicate if the graph should include percentages
- drop_na
Remove NAs from provided dataframe
Examples
data<-data.frame(categ = rep(letters[1:2], 10),
var1 = rep(LETTERS[4:5], 10),
var2 = rep(LETTERS[6:7], 10),
var3 = rep(LETTERS[8:9], 10),
var4 = rep(LETTERS[10:11], 10))
data$categ <- as.factor(data$categ)
data$var1 <- as.factor(data$var1)
data$var2 <- as.factor(data$var2)
data$var3 <- as.factor(data$var3)
data$var4 <- as.factor(data$var4)
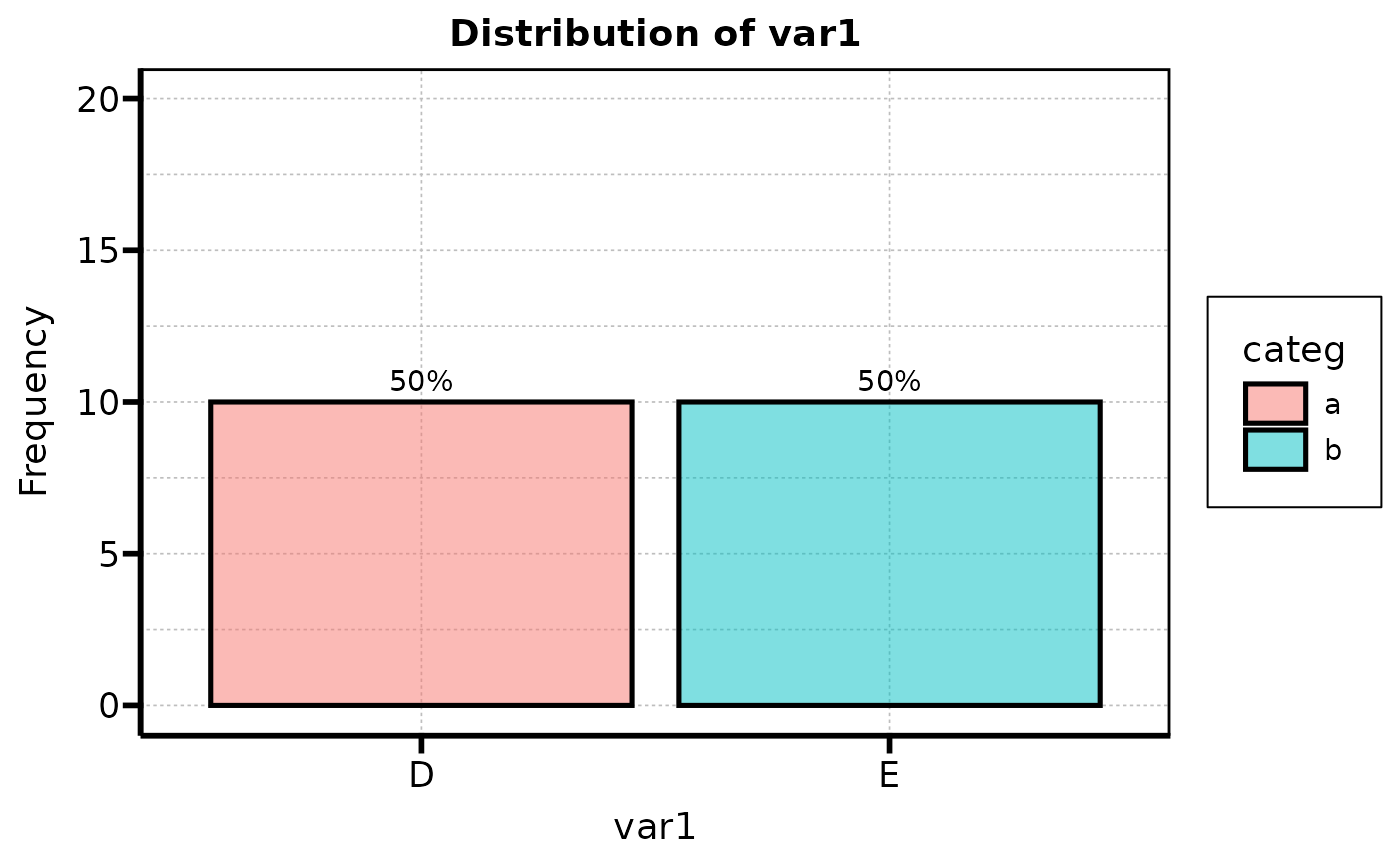
barplot_list<-auto_bar_categ(data = data, groupvar = "categ", lang_labs = "EN")
barplot_list$var1
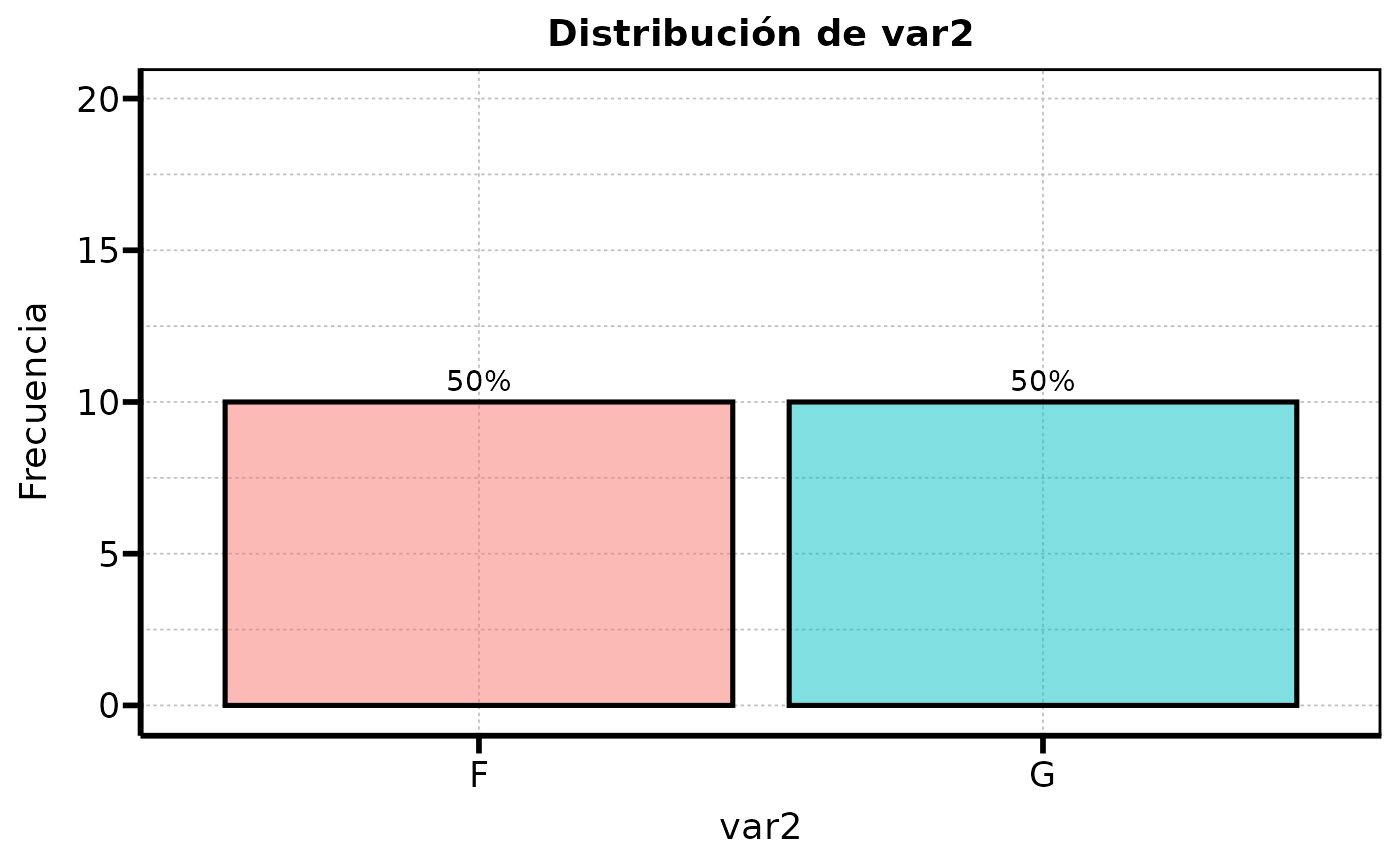
 # Example using `groupvar` argument as `NULL`
auto_bar_categ(data = data)$var2
# Example using `groupvar` argument as `NULL`
auto_bar_categ(data = data)$var2